Static site hosting speed test
I’m running this blog as a static site, which offers awesome performance and security for very little effort. Static sites also give you the option of hosting on a static host, which tend to be faster, cheaper, and easier to manage than traditional servers. The question is which host to use?
I compared the performance of various static hosting offerings from Google, Amazon, GitHub, and Cloudflare - some of the biggest players in the hosting business.
The analysis is saved in this IPython Notebook.
The Hosts
Here are the services I tested:
-
Amazon S3
S3 is an online file service from Amazon, and it's super cheap to host a static site. -
Amazon Cloudfront
CloudFront is a content delivery network (CDN) that sits in front of other Amazon offerings (for this test I used S3). CDNs your files on servers in multiple locations which should mean better speeds and uptime for users. CloudFront is slightly more pricey than S3, but Amazon will give you free SNI SSL for your custom domain which is pretty neat. -
Google App Engine
Google App Engine is a PaaS offering, but it's really easy to set up for static hosting. You get a ton of customisation options, and it's easy to make parts of your site dynamic later if you need. It comes with a free quota which will cover a significant amount of static traffic. -
Google Cloud Storage
GCS: basically S3 by Google. Similar features and pricing -
Cloudflare
Cloudflare is a CDN that will cache requests going to another service. The performance of the host behind Cloudflare shouldn't matter - for this test I chose App Engine and Google Cloud Storage because they were the easiest to set up. Cloudflare comes with a functional free plan including SSL, though you'll need a paid plan for any serious customisation. -
GitHub Pages
GitHub's Pages serves a git repository on your domain. It's free, and sites are hosted via Fastly's CDN. However, Pages has few options for customisation: you can't set headers, choose cache times, or use SSL. And although using git for deployment seems like a good idea, trying to do something like keeping draft posts private will have you wishing for separation between version control and deployment.
Many of these providers are available in multiple regions, so I spun up services in the US and Europe where possible. This gave a total of 10 hosts, each on a separate subdomain. To each one I uploaded an draft version of my homepage: a 3KB HTML file.
Method
I expected that the three CDN-backed options (CloudFront, Cloudflare, and GitHub Pages) would outperform the rest. To test this, I set up a script to request my homepage from one of the 10 hosts every 10 seconds. I recorded how long it took to download the page, as well as the response headers and any errors.
The script ran on servers located in West US, East US, and Europe. The idea was to roughly represent the distribution of “Western” internet users, so that values averaged over all the regions would be a first-order approximation of real usage.
I rented 3 VPSs each from Digital Ocean and Linode to lessen the effect of one host being particularly close to a requesting server’s datacentre. After running the script for a day to warm up servers and fill caches, I measured 14 days of data.
Results
In total, almost 600,000 requests were made. This works out at 4000 requests per day for each host, which seems like reasonable traffic for a personal blog.
To evaluate the hosts, I’ll compare error rates, average performance, and worst-case performance.
Errors
First, let’s look at when the server responded with a code other than 200 OK (in all plots, lower is better):
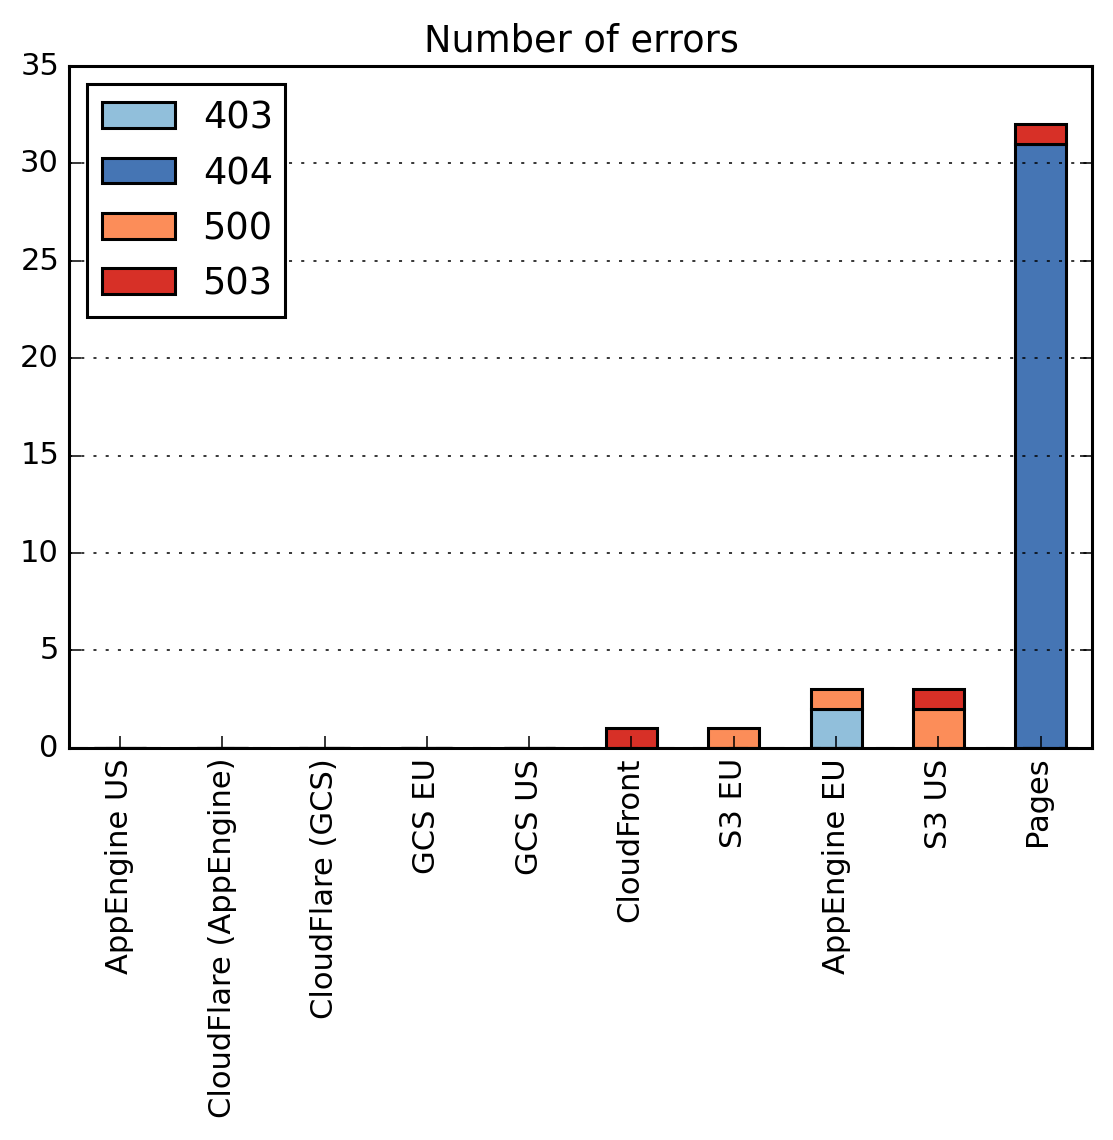
Aside from GitHub Pages, all hosts perform really well. The 3 errors experienced by and App Engine EU and S3 US still correspond to an uptime of 99.995%, and these errors are distributed in time so a browser refresh would fix any issues.
GitHub pages had a massive number of 404 errors, all within a 10 minute period:
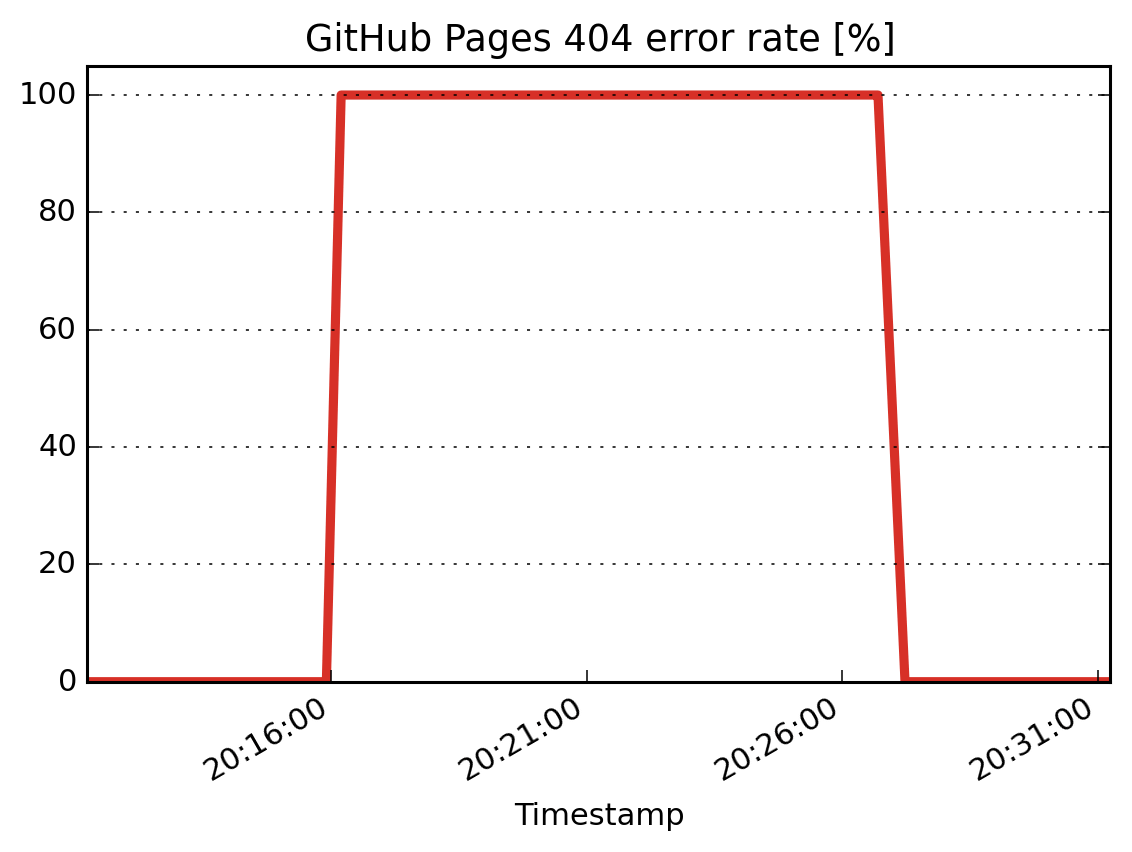
All requests from all servers failed during this time, so no users would have been able to access the site. To GitHub’s credit, the issue was reported on their status page. However, they seem to have a similar issue every month.
Winners: App Engine US, Cloudflare, GCS.
Average Speed
Time to Last Byte (TTLB) is the time taken to fetch all the data of a webpage, so is a pretty good proxy for when a user will see a completely downloaded site. (I also recorded Time to First Byte, but they weren’t significantly different for such a small payload.)
The requests are made from well-connected datacentre rather than something more realistic like a mobile network. These timing values represent a lower bound for real life performance, though the ordering of the results should remain the same even under high latencies.
Here’s the TTLB for each host:
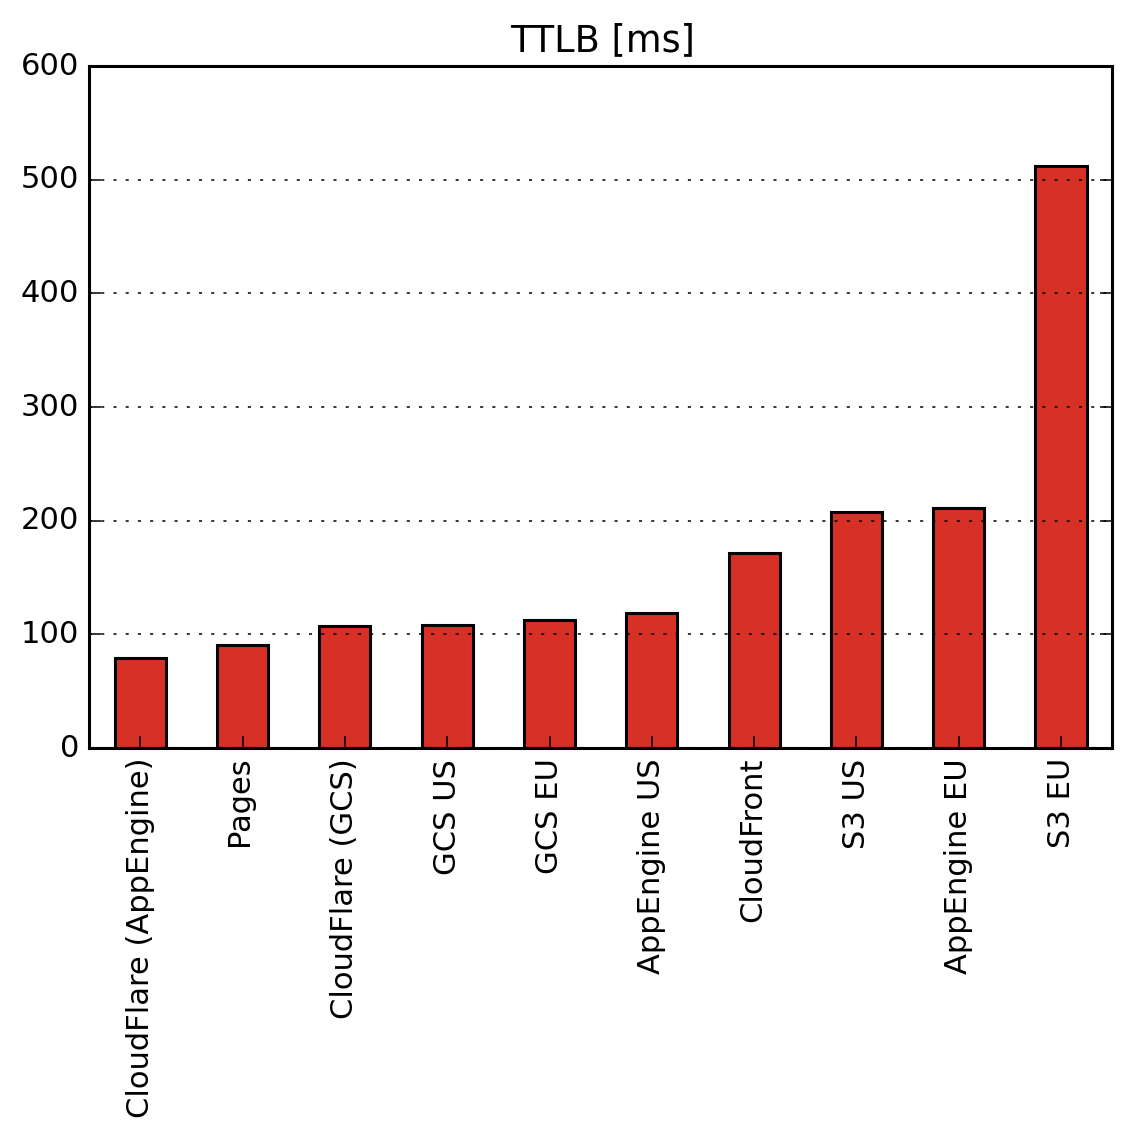
It looks like S3’s Europe region is really struggling! It’s possible that this is made worse by the majority of the requests coming all the way from the US, so here’s the TTLB from each host to just the European requesting servers:
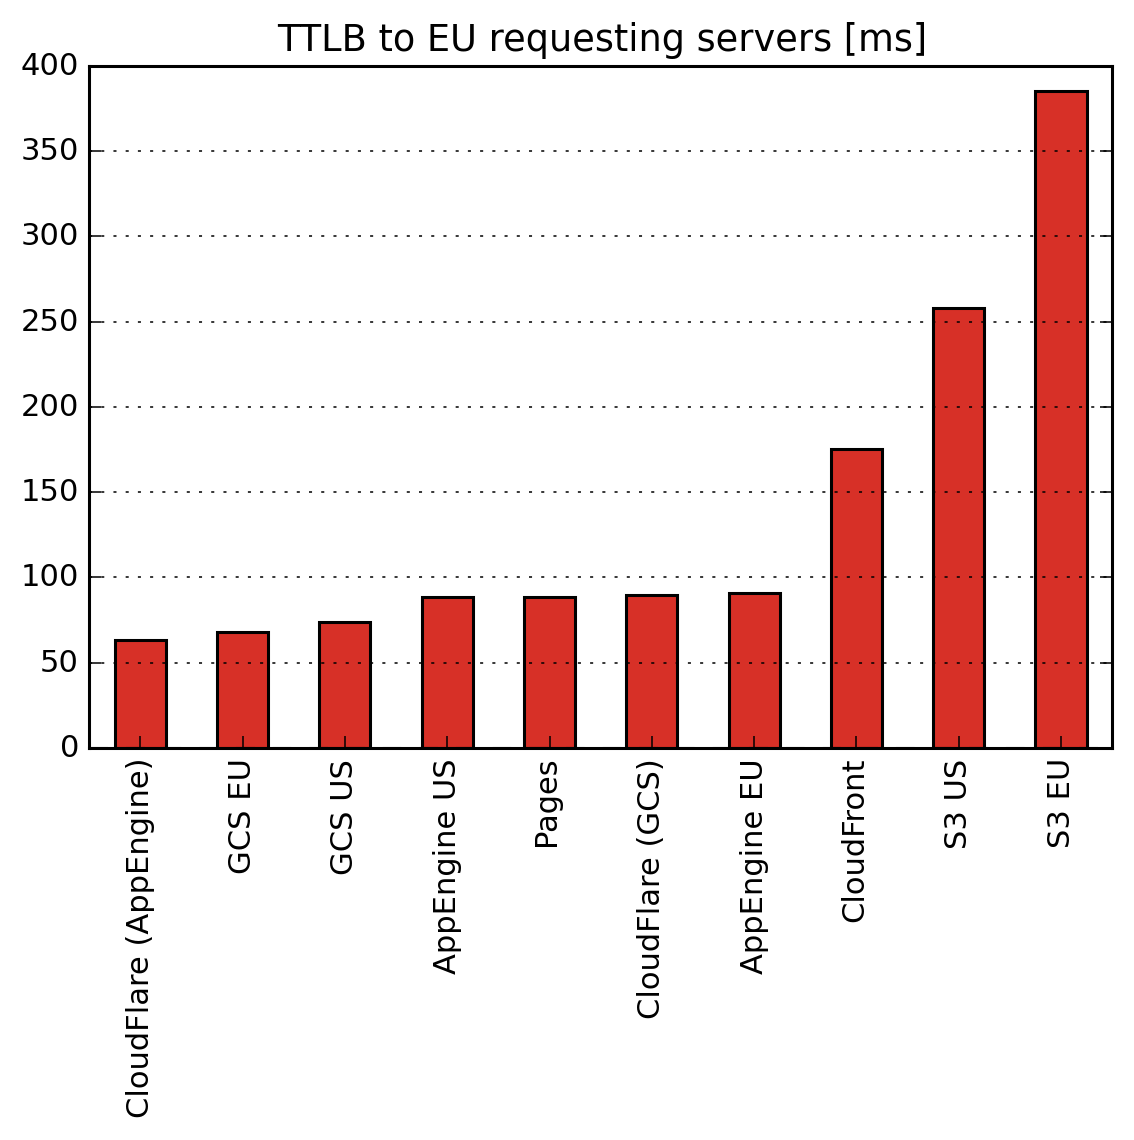
Even for requests within Europe, the US regions for S3 and App Engine perform better than the EU regions, and there’s little difference for CGS. Perhaps these EU regions were created for data privacy reasons, though the App Engine setup page hints at performance:

I’ll exclude S3 EU for the rest of speed analysis, as it’s scaling the plots too much. Let’s try the TTLB again:
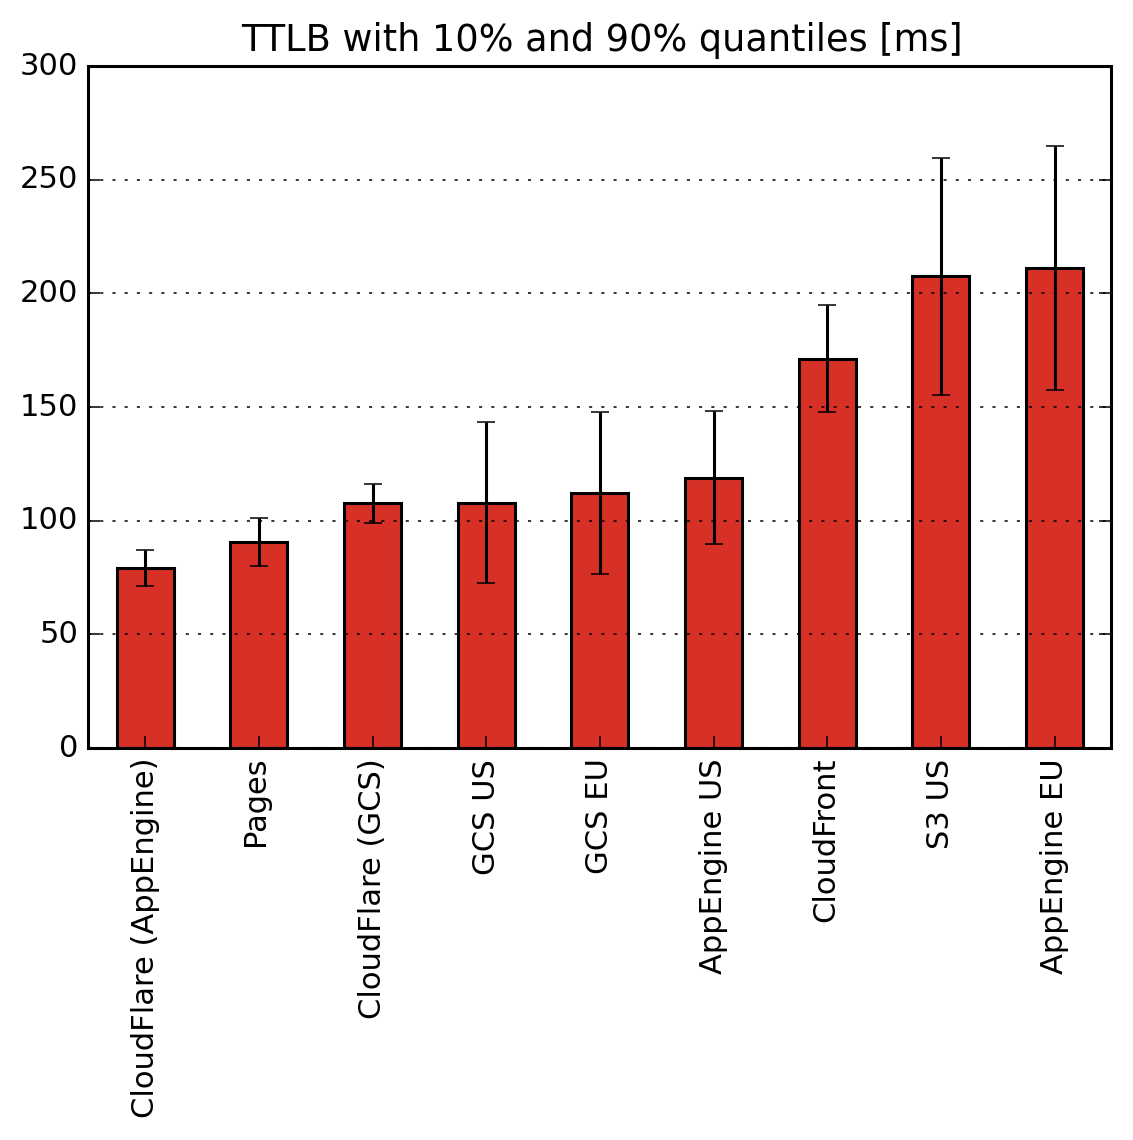
That’s better. Now we can see that Cloudflare and GitHub Pages are both coming close to the all-important 100ms threshold for human perception of instantaneous change, with little variation shown by the quantiles. Amazon’s offerings (S3 US and CloudFront) lag behind, along with App Engine’s EU region.
Winners: Cloudflare, Pages.
Edge Case Responses
Average times are a useful metric for overall performance, but the extremes are important too. A high 90th percentile response time may not affect average TTLB, but could cause that 10% of your userbase to get frustrated and leave.
Here’s the 90th percentile TTLB for the hosts:
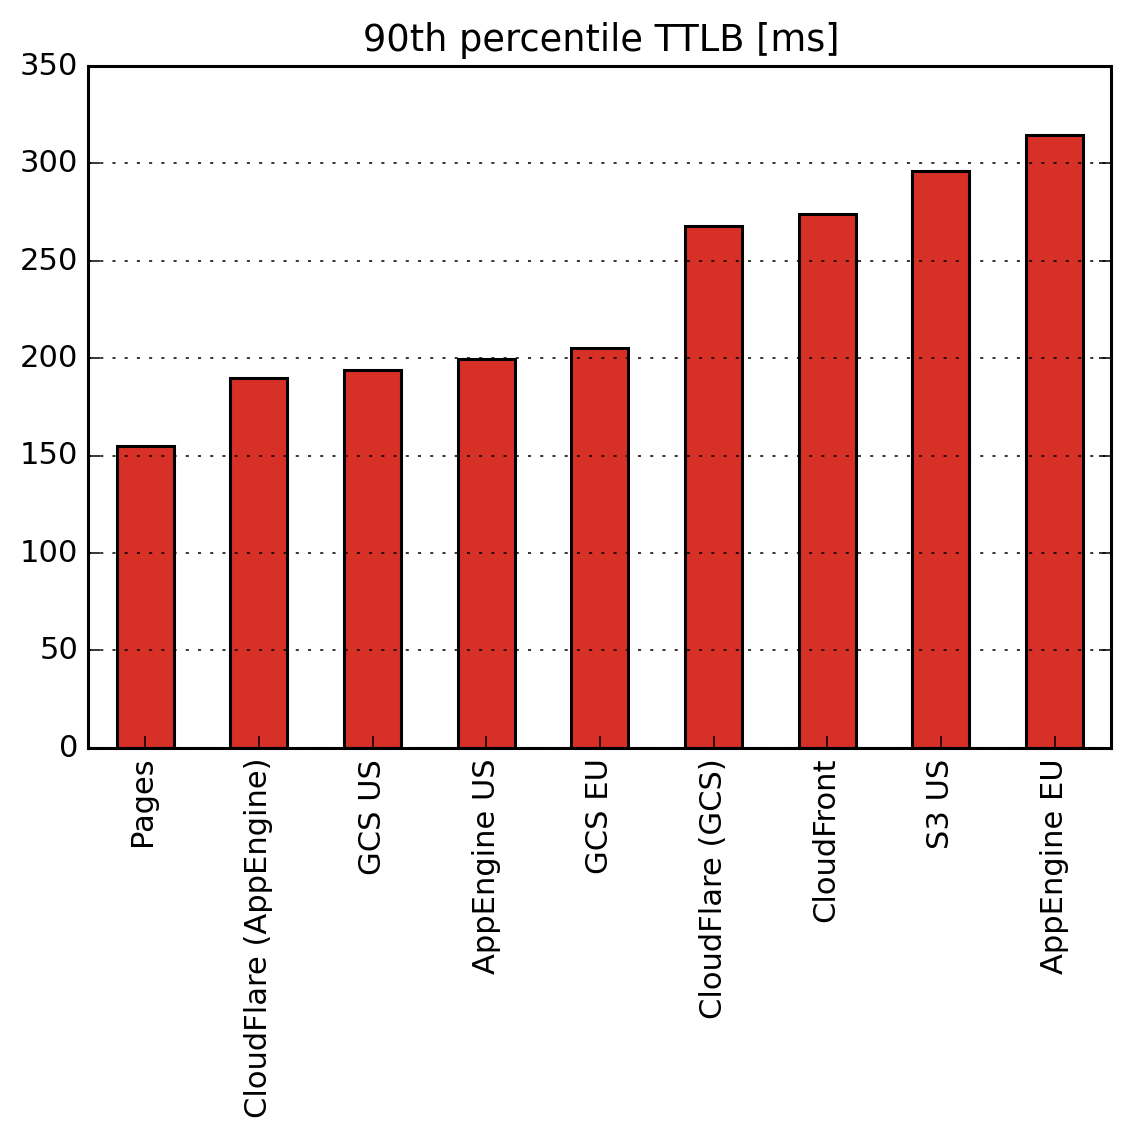 10% of users wait longer than this to make a request. And with a typical website requiring 10s of requests for scripts and other files to render a complete page, a large delay in any one of these critical assets will delay the entire page.
I feel like we’ve seen this plot already. GitHub pages performs extremely well, with Amazon and App Engine Europe brining up the rear. It’s unusual to see such a large difference between the two Cloudflare hosts, perhaps this indicates a high level of variability in the data.
We can look at the 99th percentile too:
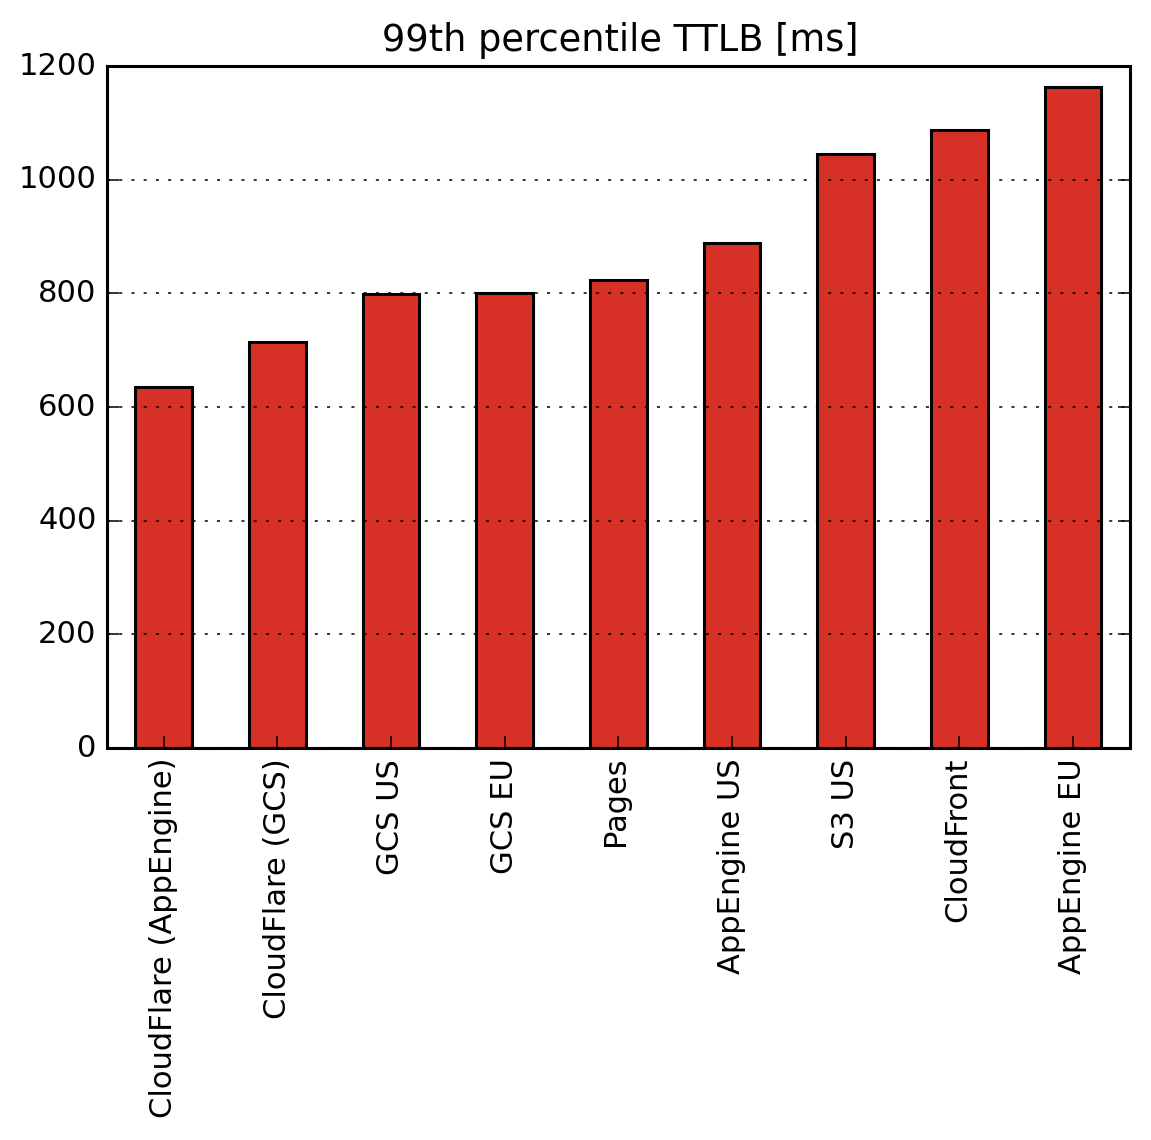 The numbers are bigger, though these events occur much more rarely. The Cloudflares are together again. Actually I’m surprised by how well all the hosts perform, 99% of requests being completed under a second.
CloudFront has risen to the highest response times, as it seems to refresh its cache fairly frequently: 2% of request miss the cache (one every 20 minutes), compared to 0.11% for Cloudflare and 0.3% for GitHub Pages. A cache refresh incurs the regular latency of CloudFront plus a round trip to the S3 backend.
Finally, the proportion of requests that take longer than an instantaneous-feeling 100ms:
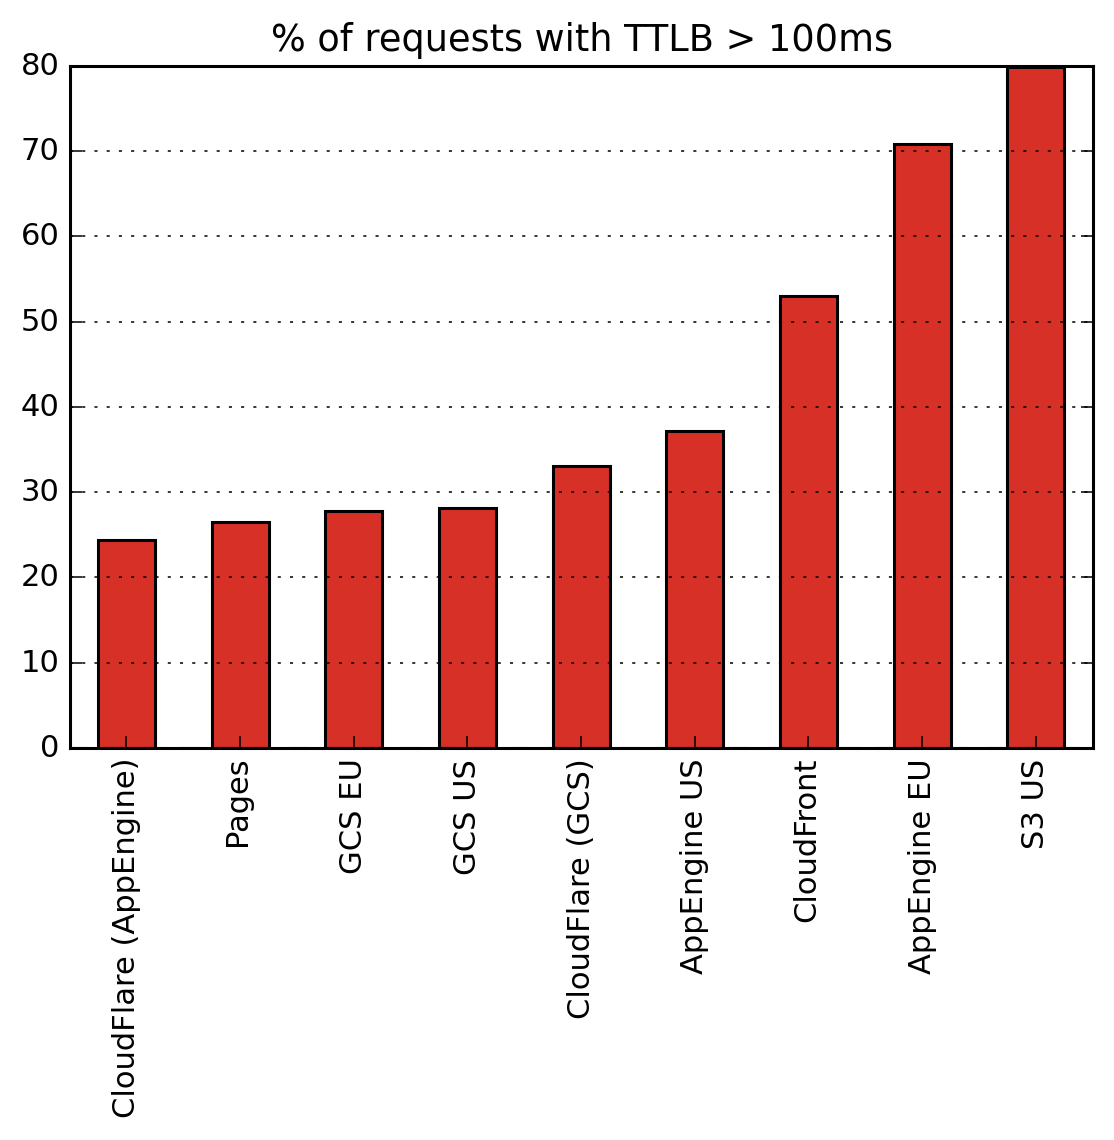 Our leaders return slow-feeling responses in only a quarter of requests. Behold the power of static sites.
Winners: Cloudflare, GitHub Pages, GCS.
Results
Cloudflare is the clear winner of this test, even on the free plan. Considering the effect size of the results, you probably also wouldn’t notice any meaningful difference with Google Cloud Storage or App Engine’s US region.
GitHub pages was just as fast as Cloudflare but seems to have downtime issues. I also feel the lack of configuration would be a problem in a lot of use cases.
S3 is slow, but has a lot else going for it as the backbone of Amazon’s AWS infrastructure. I was surprised how poorly CloudFront performs though, given how frequently I see it deployed.
So now this blog is hosted with Cloudflare, backed by Google App Engine for ease of deployment.